
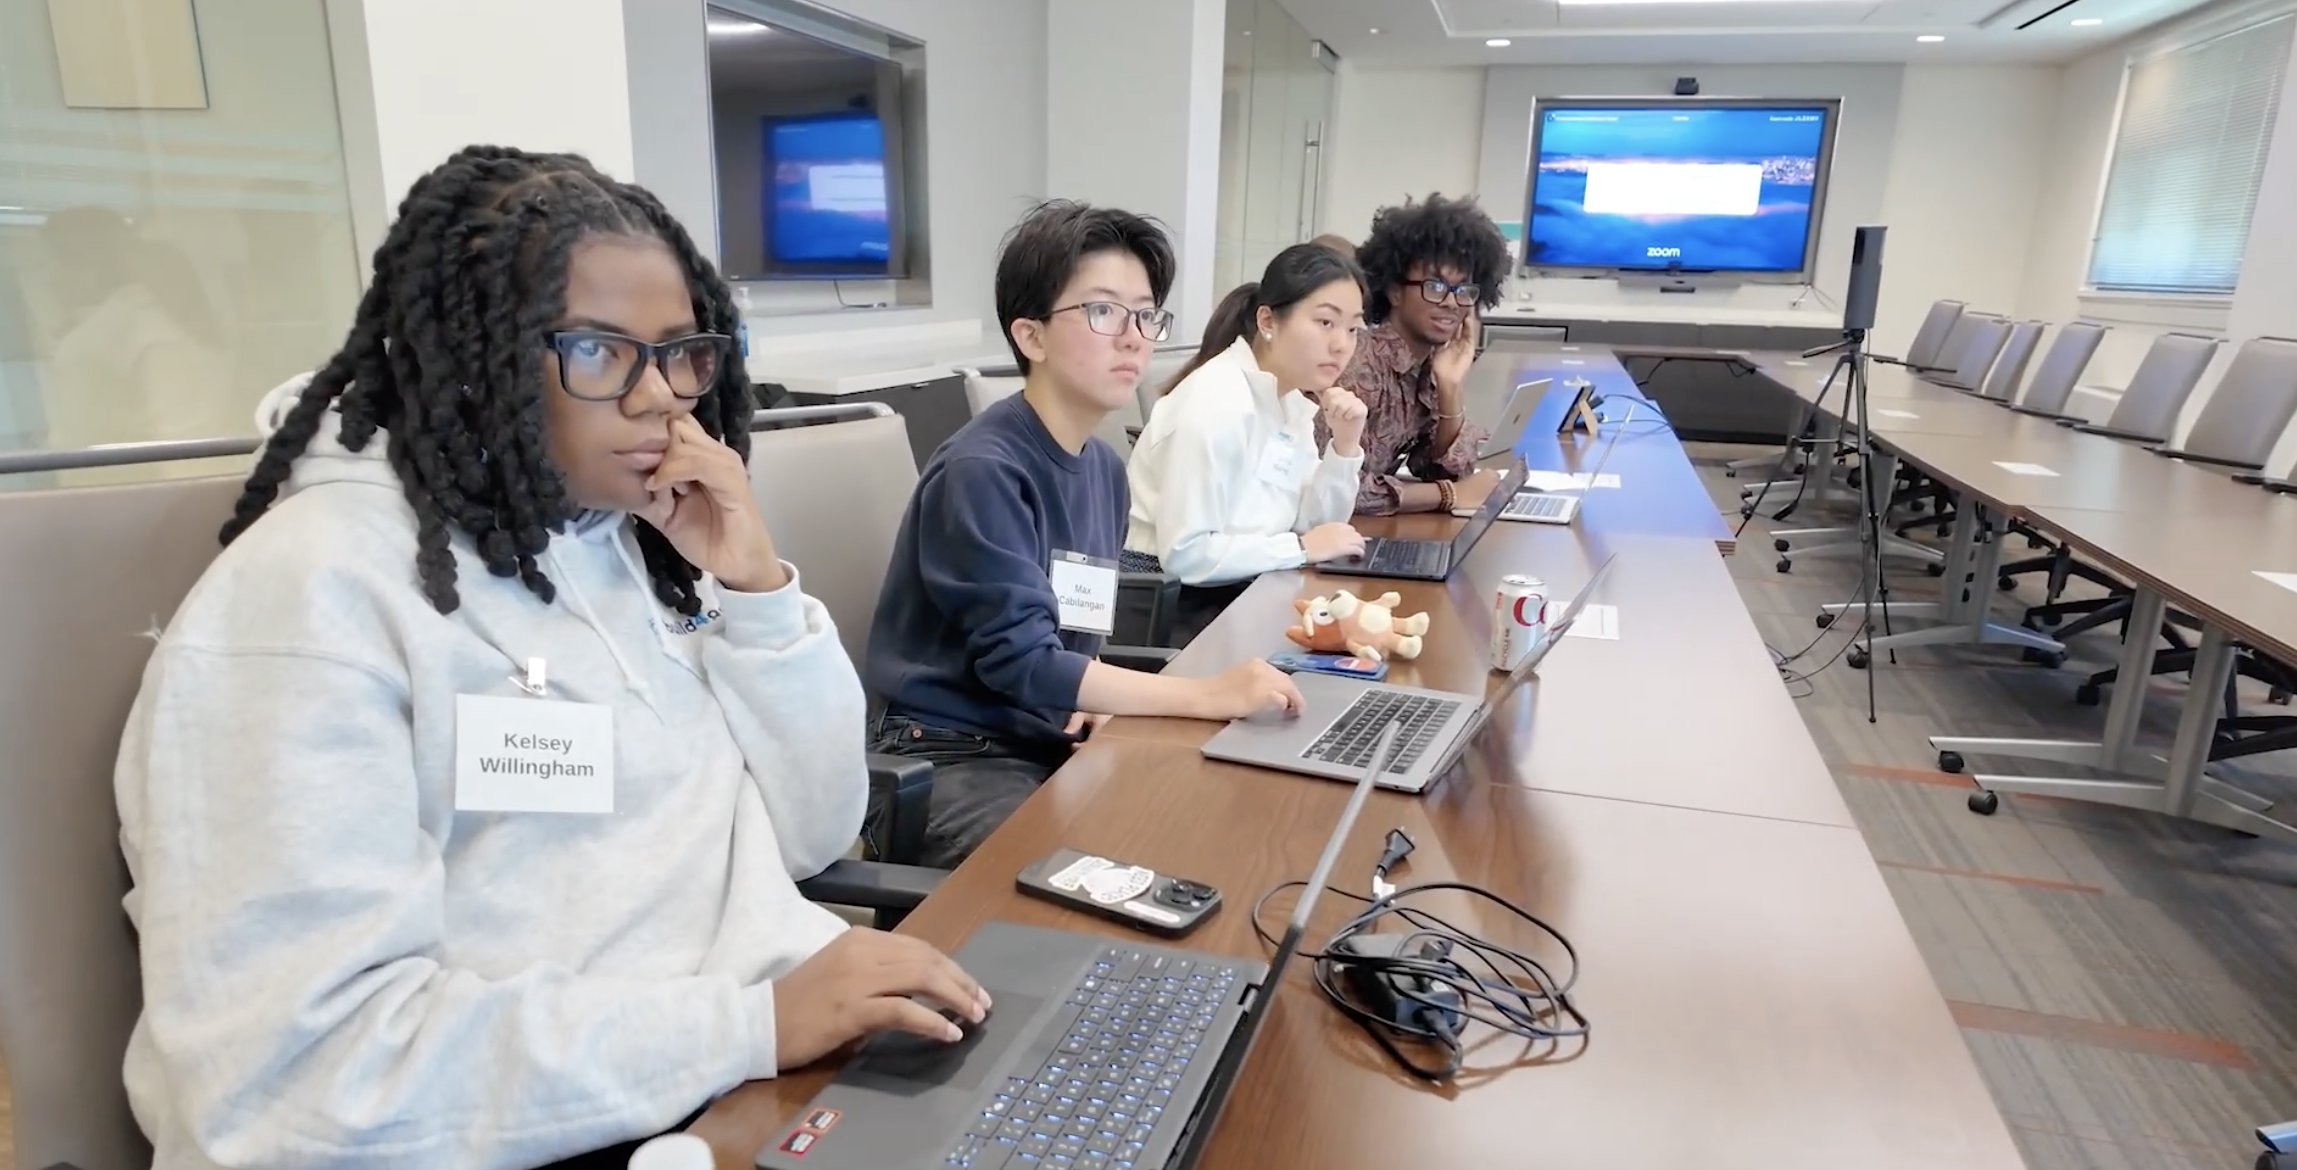
This summer, I worked with DogTag Inc. to help fix and continue to build a centralized Power BI reporting system that brings together sales data from the organization’s café bakery, e-commerce store, and catering business.
About the project
Dog Tag Inc. is a nonprofit that equips veterans, military spouses, and caregivers with the tools to rediscover their purpose after serving our nation, and to reenter their communities with confidence and support. Part of how Dog Tag supports that mission is through its social enterprise of a café bakery, an online store, and a catering service. The revenue from these businesses helps sustain the organization’s programs.
Each of these channels runs on its own platform. In-store café sales go through Clover, online orders through Shopify, and catering orders through Wix. Each system worked well for day-to-day operations. However, the sales data ended up in three separate places, with three different structures.
Context
The Challenge
They originally had a dashboard built by another company, but it stopped working in 2025 and the instructions given were in a super technical way. Answering a basic question like “What were our top-selling items last month?” wasn't possible without going into each individual sales platform exporting reports from each system since the dashboard was no longer live. The process was slow and error-prone, and it depended on whoever knew how to do it.
The platforms couldn’t simply be combined, either. Each one records orders, items, and totals differently. Wix, for example, stores multiple items in a single field, while Clover and Shopify break them out line by line. Merging them without care would double-count orders and produce numbers that couldn’t be compared across channels.
My goal was to fix and optimize a single, reliable reporting tool that staff without a technical background could use to understand sales and make decisions.
I started by designing a unified data model in Power BI. I pulled in data from all three platforms and connected it through a shared calendar table, so every channel could be analyzed on the same timeline.
Next, I needed metrics that meant the same thing regardless of where a sale came from. I wrote custom DAX measures that were requested by the team like Average Order Total over each week. These measures account for each platform’s structure, so a café order and a catering order are counted consistently, and orders aren’t double counted.
Much of the project was debugging. Some visuals came up blank or showed incorrect numbers when filtered. I traced these problems to relationship and filter-propagation issues in the model. In one case, a filter meant for one data source was applied to the entire report. I learned to isolate one variable at a time until I found the root cause, and the fixes made every slicer and chart cross-filter accurately.
The final product is a four-page dashboard suite: a Main Dashboard plus dedicated pages for Cafe Bakery Sales, E-Commerce Sales, and Catering Sales. Each page includes interactive daily sales trends, revenue by item, and top-seller rankings.
To keep the tool useful after my fellowship ended, I also wrote Standard Operating Procedures. They cover refreshing the data, troubleshooting common issues, and adding new sales channels. With them, the dashboard can be maintained without relying on any one person.
What stands out to me about my build4good project is how much it stretched me. I came in as a data analytics student who knew the concepts. I left having debug a full data model, solved problems that didn’t have a tutorial, and delivered something an organization actually uses.
Working remotely with limited real-time access to my manager pushed me to become more self-sufficient. I learned to work through a problem thoroughly and document what I’d tried before asking for help. I also learned that the technical build is only half the job. Translating business questions into the right visuals and explaining my progress to people without a data background.
Solution
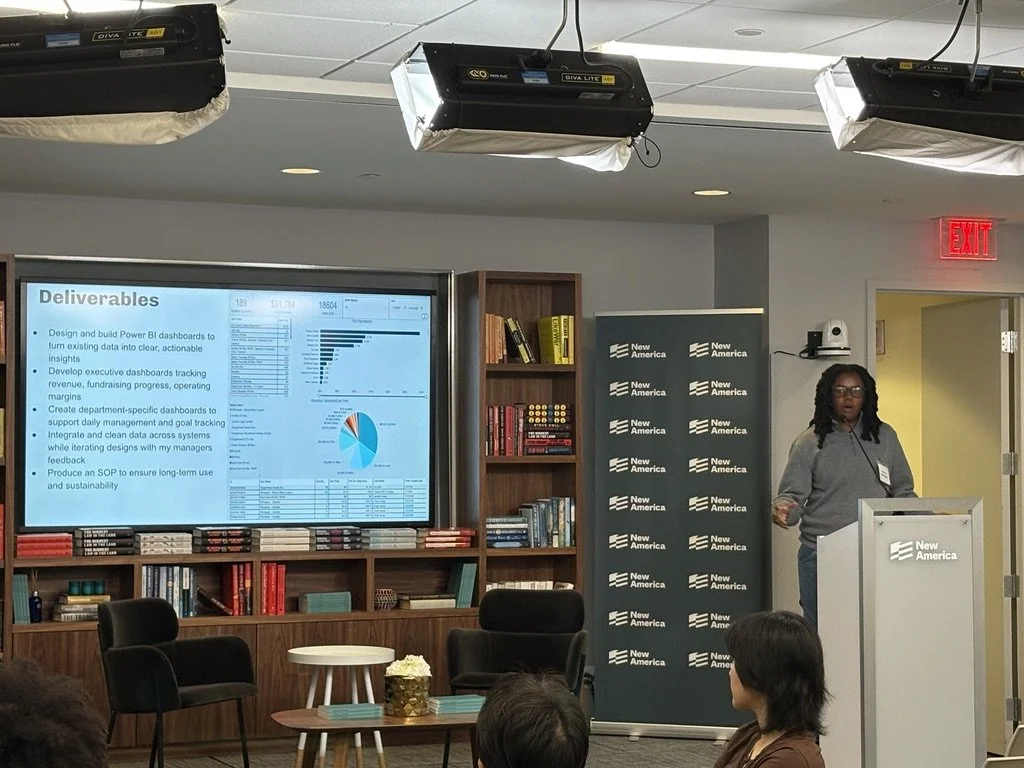
The people made this summer. Through build4good and Dog Tag, I met an amazing cohort, and I learned as much from the other students as I did from the program itself. The guest speakers opened my eyes to the policy side of technology, especially the conversations around how AI should be used and governed. That is a perspective I hadn’t considered much as a student. Convening in Washington, D.C. made all of it feel more personal. It’s one thing to hear about technology policy and another to discuss it in the place where those decisions are made.
The team at Dog Tag was incredible to work with. Getting to visit the bakery in person was a highlight of the summer. Seeing the café, the staff, and the mission up close made the numbers in my dashboard feel real. Every order represented part of a community supporting veterans, military spouses, and caregivers. That visit reminded me that I wasn’t just building a report, but I was contributing to a great cause. I’m grateful to build4good and Dog Tag for an experience that showed me what it looks like to use data for good.